Stage 7
- The first stage of analysing the measurement results concerned the best-fit process of the measurement points (Fig. 1), creating the point cloud, to the nominal model of the investigated product.
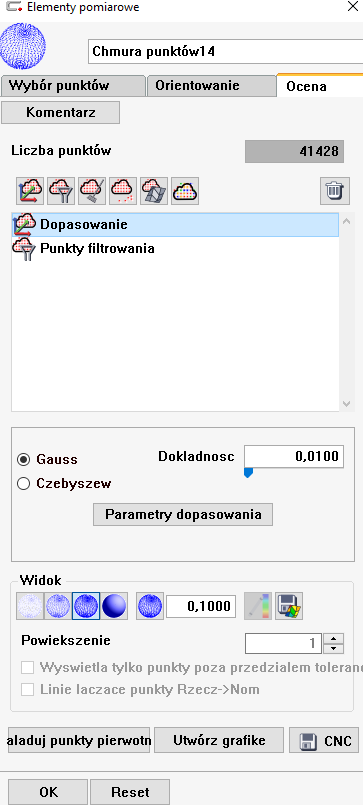
Fig. 1
- The result of the best-fit process is presented in the figure 2.
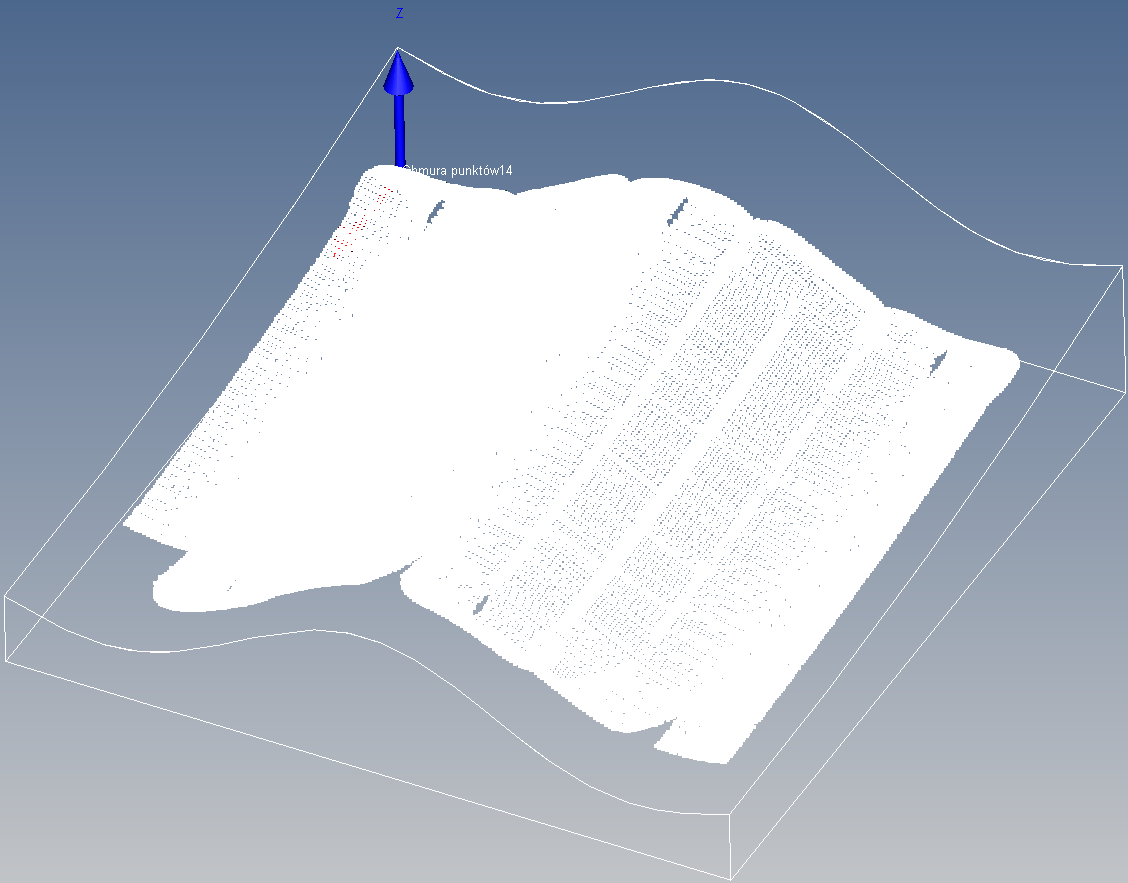
Fig. 2
- The next step was to filter the measurement points in order to decrease their number (Fig. 3).
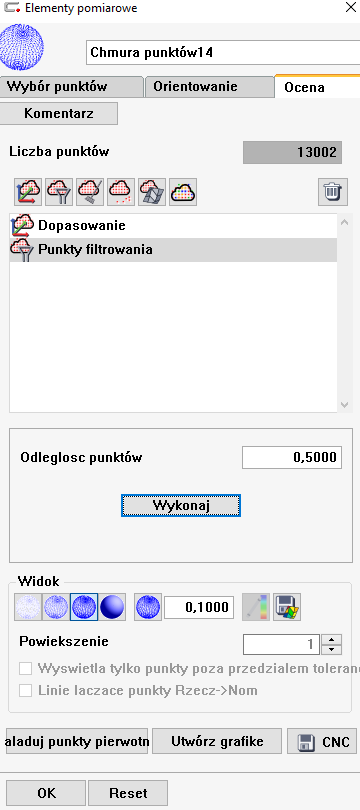
Fig. 3
- The result of the filtration is shown in the figure 4.
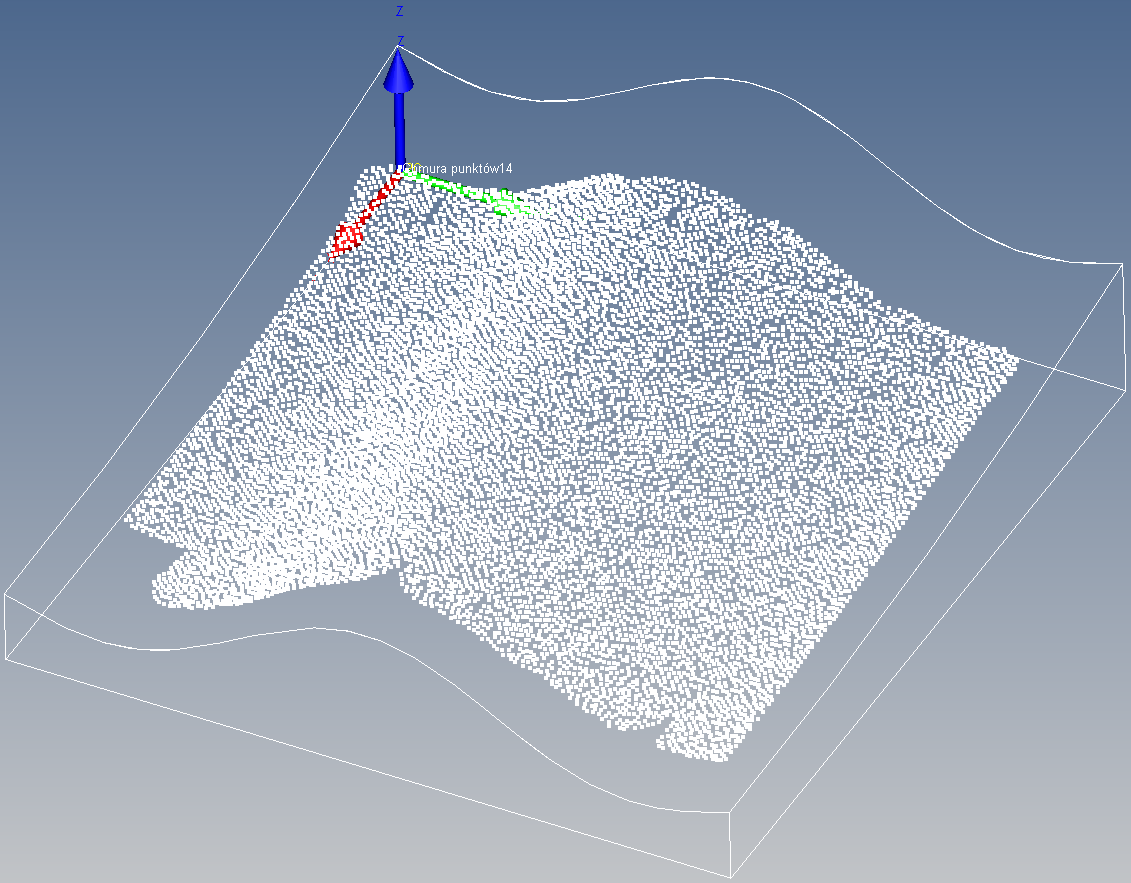
Fig. 4
- Outliers were also automatically removed by using the functions of the measurement software (Fig. 5).
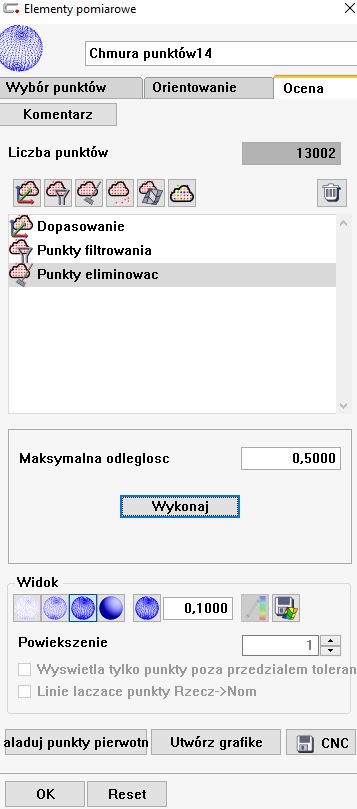
Fig. 5
- The last stage of analysing the results concerned the presentation of the map of the form deviations created by comparing the processed point cloud to the nominal model of the measured part (Figs. 6 and 7). The value of the tolerance was equal to 0.2 mm.
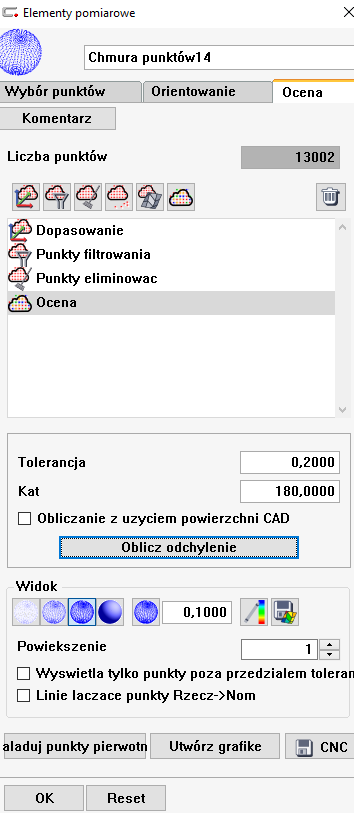
Fig. 6
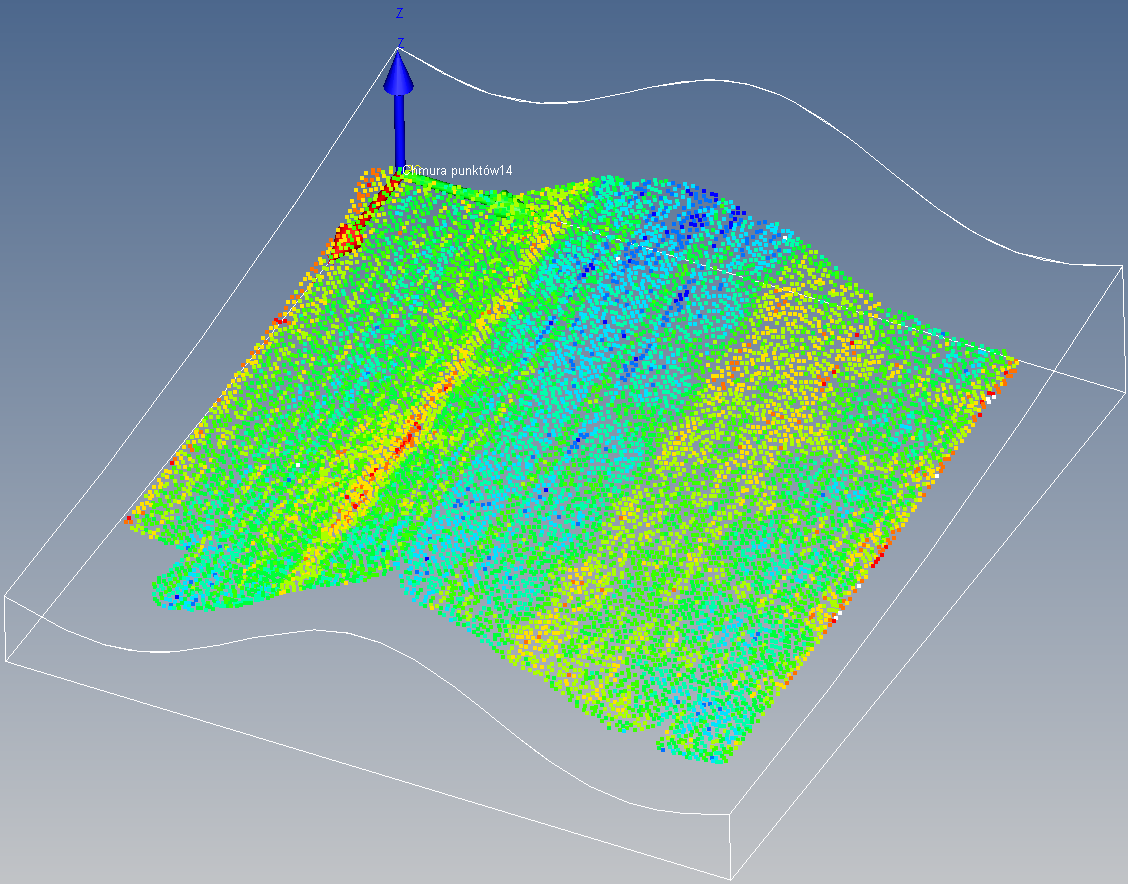
Fig. 7
Last modified: Thursday, 4 August 2022, 2:27 PM